
The situation
Preslar's is a Louisville institution. Real inventory, real staff, a healthy in-store business, and a name people around here already know.
The online side had quietly stopped working. Thousands of products carried thin titles and missing descriptions, so Google had almost nothing to read. Worse, an account-level policy flag had put the entire catalog into a limited state in Google Merchant Center. The whole store was effectively switched off in Google Shopping, and it had been that way long enough that nobody remembered it being any different.
That's the pattern most local retailers hit eventually. The storefront is fine. The online side belongs to nobody.
What we did, in order
- First, audit everything Before touching anything I mapped the whole stack: the ecommerce platform, the product data, the Google Ads account, the Merchant Center feed, and the tracking. The point was to know what was safely fixable, what needed the platform vendor, and what order to do it in.
- Rebuild the product data, in batches Rewrote titles, descriptions, and category structure across thousands of products. Every batch got verified against the store's own back office before I called it done. Nothing was marked complete on faith.
- Clear the Merchant Center flag Fixed the policy problems behind the account-level flag and got the business verified with Google. In June the flag cleared and the catalog came back into Google Shopping.
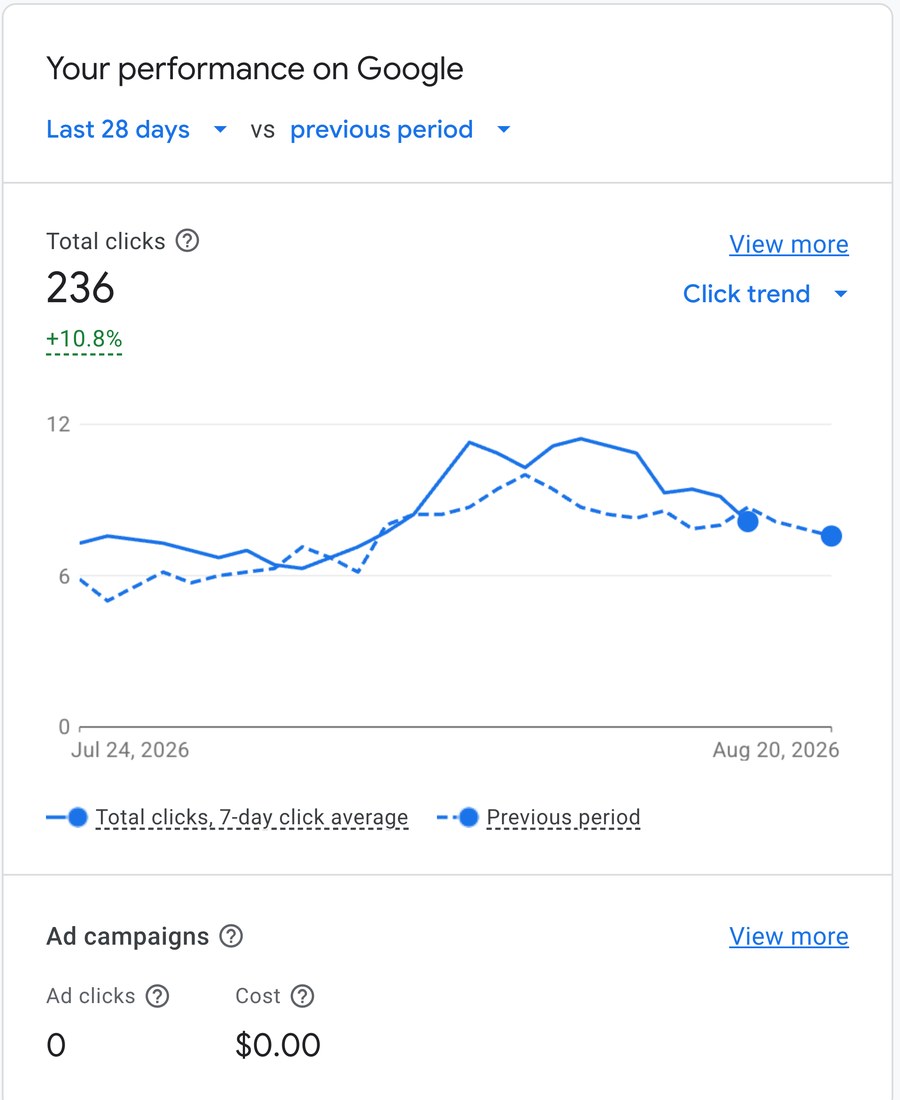
- Let the free listings work With the catalog eligible again, free Google Shopping listings started earning clicks for the first time. That's shelf space on Google the store had never occupied, at no ad cost.
- Measure it properly I split the rebuilt products into two groups by the date each one was pushed, then compared each group against the other. If the lift were just spring demand or the site redesign, both groups would move together. They didn't. Each group only jumped after its own push.
What the numbers did
These are the product pages we rebuilt, measured in Google Search Console. The impressions comparison right below uses two equal 28-day windows, so it compares directly. The page-count and catalog-share comparisons further down use an earlier pair of windows (16 March–13 April vs 17 May–9 June 2026) that are different lengths, so those are stated per day.
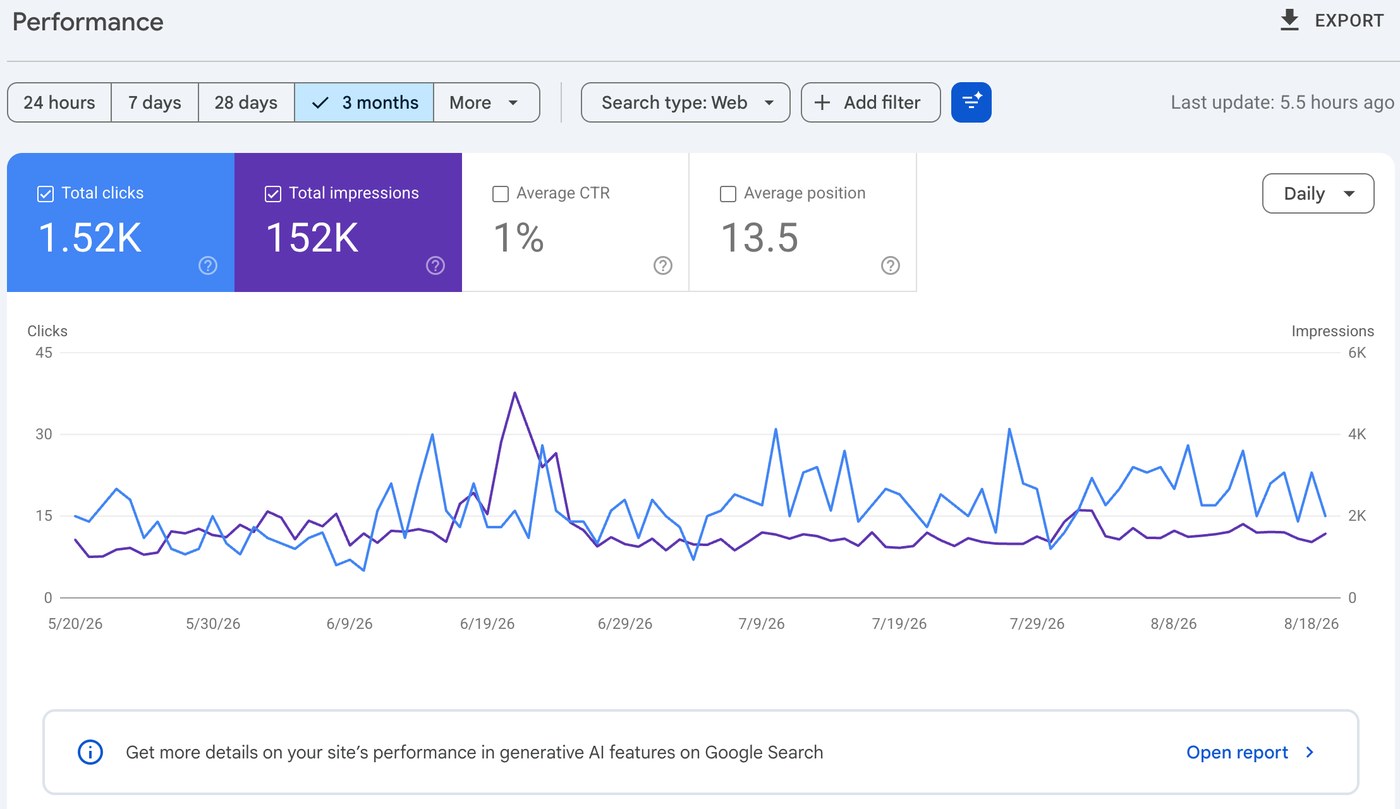
1,241 impressions over 28 days (24 Mar–20 Apr 2026), then 18,603 over 28 days (3–30 Aug 2026). Site-wide impressions grew 1.2x over the same two windows, so this isn't just a seasonal or sitewide lift.
Of the 2,045 rebuilt product pages, the share earning at least one impression went from 17.7% to 50.4%.
433 of 2,090 live product pages, then 1,105. Sitewide, not just the rebuilt batches.
Zero before the Merchant Center flag cleared. Still climbing, and none of it is paid.
Two more things moved. The store's search footprint grew from 3,286 distinct queries to 5,138, which is 3,596 queries the site had never appeared for. And as of the June 2026 measurement, Preslar's held a top-five average position for the local terms that actually matter: western store louisville ky, cowboy boots louisville ky, work boots louisville ky, and western wear louisville ky.
And then July happened
July 2026 was the store's best month for online revenue in the seven years of sales history on record. Not their best July. Their best month, beating every December in the dataset.
July on its own beat May and June put together, and it beat the next best month of 2026 by more than two to one.
The orders also travelled. In July, 14 of the store's 15 online orders went to customers outside Kentucky, and all 15 were shipped rather than picked up in store. Across 2026 so far, 34 of 44 online orders went to 18 states outside Kentucky.
That part isn't new. Preslar's has been shipping out of state since 2019. What changed is the volume, and July is the highest out-of-state concentration in the record.
I'm not going to publish their revenue. That's their business, not mine.
Online orders per month
Online orders by month, September 2025 through August 2026, from the store's own order history. Muted bars are before the engagement started; orange bars are after. Goal line is the owner's stated target of 1 online sale a day (30/month). August's 18 orders is 60% of that goal.
Where these numbers come from. The search figures come from the store's own Google Search Console, the free-listing clicks from Google Merchant Center, and the sales numbers from its own order history. Search Console data for this store starts 24 March 2026, so the growth figures compare two equal 28-day windows inside that period, not a full year. Every number here comes straight from those accounts, not a projection.
The proof
Two screenshots, taken from the live accounts on 20 August 2026.
Why this worked
None of it was one dramatic move. It was sequence and follow-through.
Audit first. Fix the product data. Clear the thing blocking the whole catalog. Then let free listings do their job on top of clean data, and check every step against real numbers instead of assuming it landed.
That's the part a local business usually can't get without hiring a full-time digital person. Not a redesign. Somebody who actually owns the online side week after week.
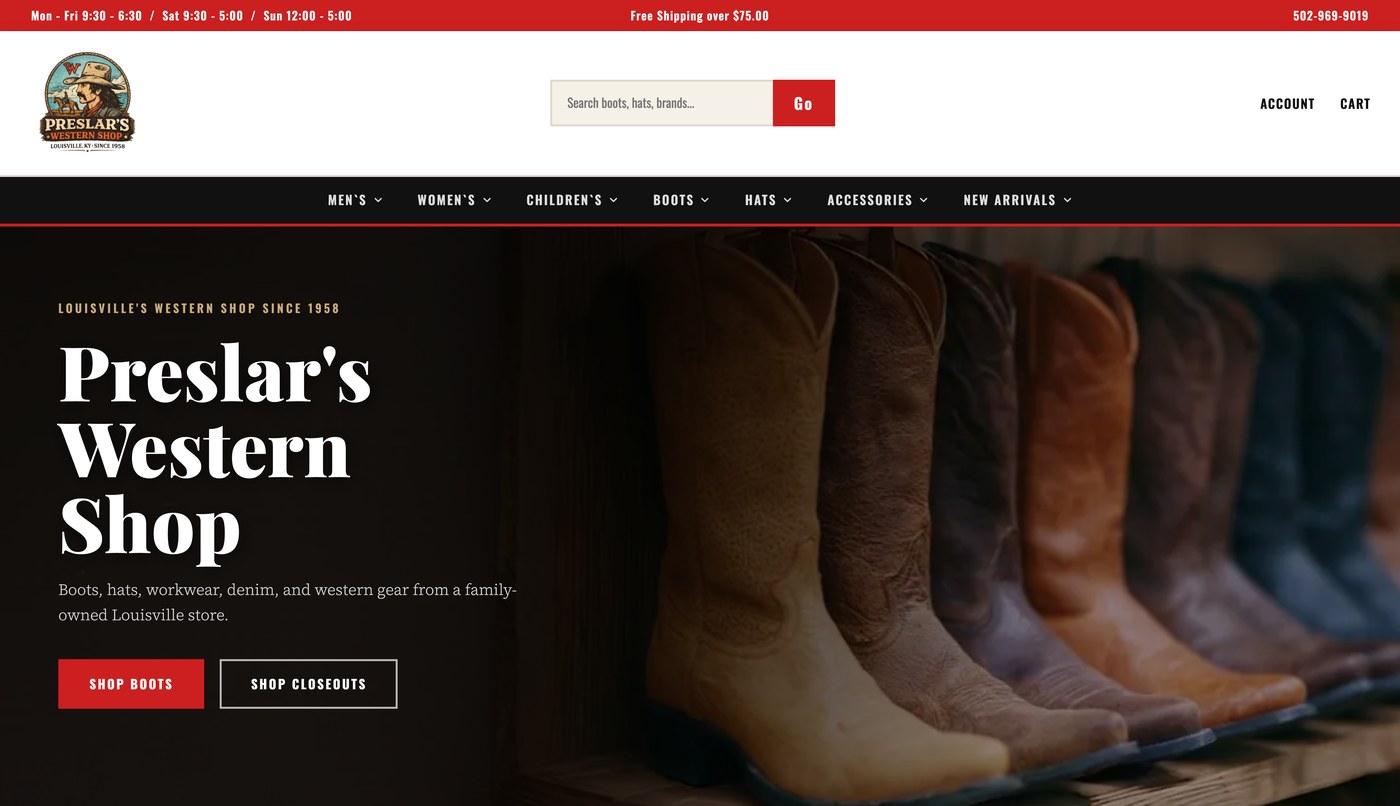
Go see the store for yourself.
Boots, hats, workwear, and denim from a family-owned Louisville shop that's been at it since 1958.
The pattern this fits
This is the local retail and ecommerce cleanup pattern. It works the same way for boutiques, specialty retailers, and inventory-heavy local stores on older platforms. Anywhere the products, the ads, or the tracking have nobody really owning them.
If the catalog side isn't your problem and you just need to be found, that's the smaller version of the same work. It lives on the Louisville SEO company page.
If the storefront is solid but the online side feels messy, this is what fixing it looks like.